Satellite
monitoring
Satellite monitoring
Irreo uses maps from different satellite constellations to monitor the water requirements and phenological status of various types of field crops, without the need to install and maintain any sensors.

Irreo uses maps from different satellite constellations to monitor the water requirements and phenological status of various types of field crops, without the need to install and maintain any sensors.
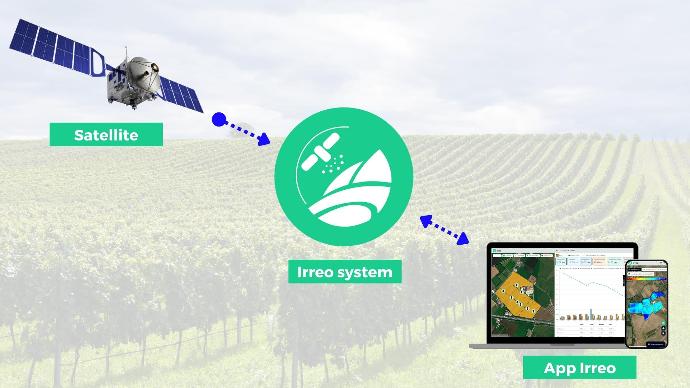
1) Satellite map analysis
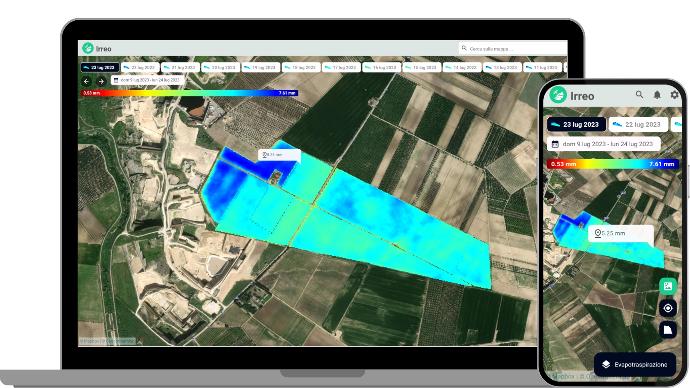
Evapotranspiration
Spatial resolution
9 sqm, 3x3 metres pixels
Time resolution
daily update
Evapotranspiration (ET) is defined as the amount of water that is transferred to the atmosphere by the phenomena of direct evaporation from the soil and vegetation (interception) and transpiration of vegetation.
We speak of actual evapotranspiration when it represents the actual amount of water that is transformed into vapour by the combination of atmospheric factors and vegetation. Unlike potential evapotranspiration, real evapotranspiration depends on the water content of the soil in addition to climatic factors (temperature, wind, relative humidity, etc.).
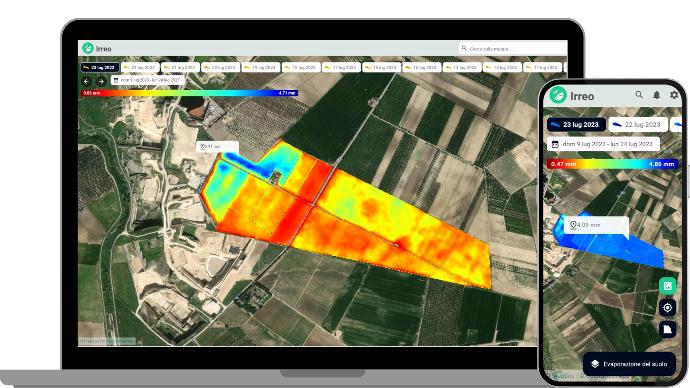
Leaf transpiration & soil evaporation
Spatial resolution
9 sqm, 3x3 metres pixels
Time resolution
daily update
Irreo is the only service that can distinguish between foliar transpiration and soil evaporation. Distinguishing between soil evaporation and foliar water consumption allows you to implement different irrigation strategies with respect to crop type and phenological status.
Leaf transpiration & soil evaporation
Spatial resolution
9 sqm, 3x3 metres pixels
Time resolution
daily update
Irreo is the only service that can distinguish between leaf transpiration and soil evaporation.
Distinguishing between soil evaporation and leaf water consumption allows you to implement different irrigation strategies according to crop type and phenological status.

Can irrigation be planned using evapotranspiration?
Discover the basic approach used by Irreo for dynamic irrigation
Can irrigation be planned using evapotranspiration?
Discover the basic approach used by Irreo for dynamic irrigation
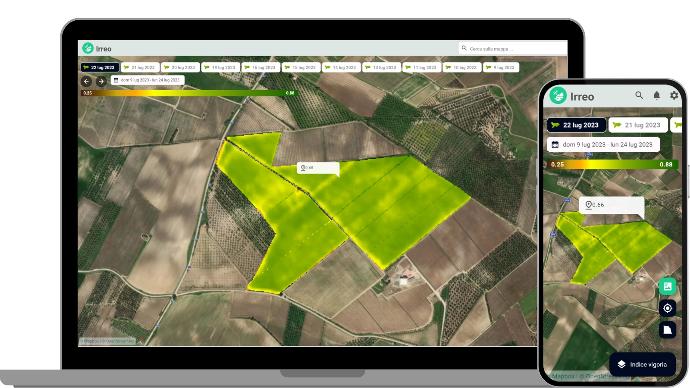
Vigour index
Spatial resolution
9 sqm, 3x3 metres pixels
Time resolution
daily update, depending on cloud cover
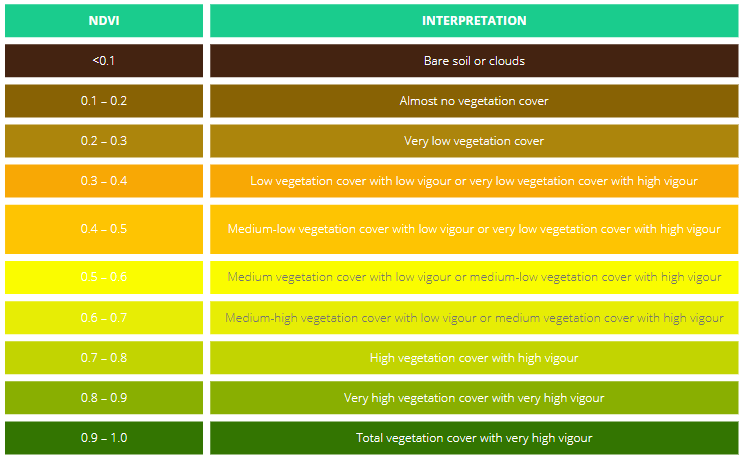
The vigour index (NDVI) describes the level of vigour of the crop and is calculated as the ratio between the difference and the sum of the reflected near-infrared and red radiation.
The interpretation of the absolute value of the NDVI makes it possible to immediately recognise the areas of the field that show development problems.
The NDVI is a simple index to interpret. Values can vary between 0 and 1, each value corresponding to a different agronomic situation.

Vigour index
Spatial resolution
9 sqm, 3x3 metres pixels
Time resolution
daily update, depending on cloud cover
The vigour index (NDVI) describes the level of vigour of the crop and is calculated as the ratio between the difference and the sum of the reflected near-infrared and red radiation.
The interpretation of the absolute value of the NDVI makes it possible to immediately recognise the areas of the field that show development problems.
The NDVI is a simple index to interpret. Values can vary between 0 and 1, each value corresponding to a different agronomic situation.

The average NDVI of a field varies according to the variety and phenological stage of the crop. In the same field or in adjacent fields in which a crop is at the same phenological stage, areas in which the NDVI value is significantly lower than the average show problems in vegetative development, which can be caused by quite different factors such as:
- nutritional stress;
- parasite attacks;
- heavy hail or frost damage;
- low emergency.
To identify potential problem areas in each field, we identify the minimum and maximum NDVI value in the field.
The field is then recoloured on the map by associating brown colour with the minimum value, and green colour with the maximum value.
Leaf area index
Spatial resolution
9 sqm, 3x3 metres pixels
Time resolution
daily update, depending on cloud cover
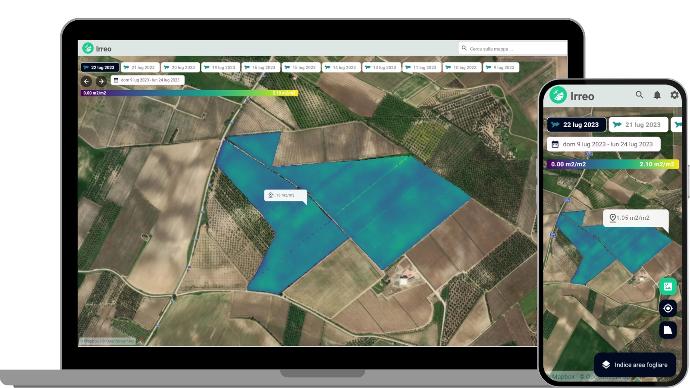
Leaf area index (LAI) is one of the main biophysical variables of vegetation and represents the ratio of square meters of foliage per square meter of soil (m²/m²). Irreo uses LAI estimation and its spatial distribution to define the phenological status of the culture, monitor crop growth, estimate yield, and monitor vegetation stress in order to suggest best practices for irrigation management.
Leaf area index
Spatial resolution
9 sqm, 3x3 metres pixels
Time resolution
daily update, depending on cloud cover
Leaf area index (LAI) is one of the main biophysical variables of vegetation and represents the ratio of square meters of foliage per square meter of soil (m²/m²). Irreo uses LAI estimation and its spatial distribution to define the phenological status of the culture, monitor crop growth, estimate yield, and monitor vegetation stress in order to suggest best practices for irrigation management.

Leaf coverage index
Spatial resolution
9 sqm, 3x3 metres pixels
Time resolution
daily update, depending on cloud cover
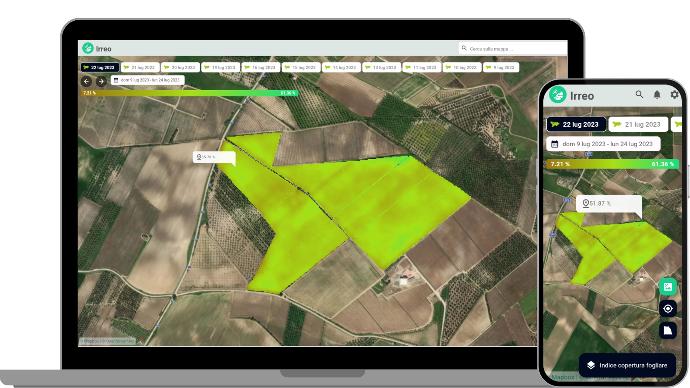
Leaf cover index (FVC) is an important indicator of the degree of greenness of the crop and has a strong correlation with biomass. This parameter represents the fraction of the soil area covered by green foliage in the two-dimensional plane, and is expressed as a percentage.
Irreo uses this parameter to separate vegetation from soil in energy-balance processes, including temperature and evapotranspiration, and for characterization of crop growth status throughout the season to optimize precision irrigation management.

Leaf chlorophyll content
Spatial resolution
10x10 metres pixels
Time resolution
update every 3/4 days, depending on cloud cover
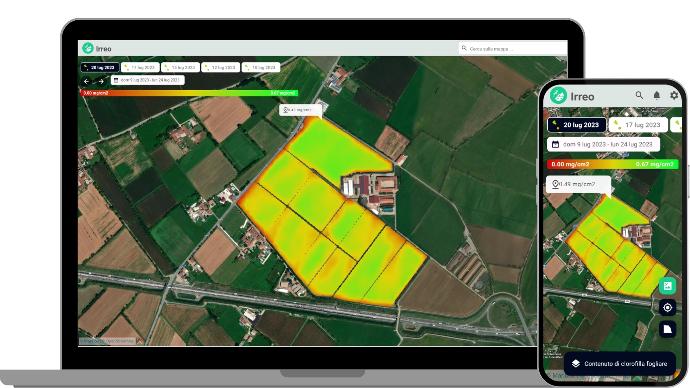
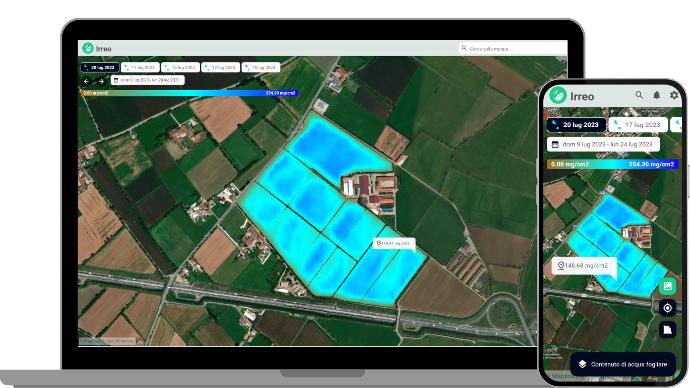
Chlorophyll content (CCC) is an excellent indicator of stress, including nitrogen deficiencies. It is strongly related to leaf nitrogen content and is expressed in milligrams per square centimeter (mg/cm²). This quantity can be calculated at both leaf and canopy level by multiplying leaf chlorophyll content by leaf area index.
Leaf chlorofyll content
Spatial resolution
10x10 metres pixels
Time resolution
update every 3/4 days, depending on cloud cover
Chlorophyll content (CCC) is an excellent indicator of stress, including nitrogen deficiencies. It is strongly related to leaf nitrogen content and is expressed in milligrams per square centimeter (mg/cm²). This quantity can be calculated at both leaf and canopy level by multiplying leaf chlorophyll content by leaf area index.
Leaf water content
Spatial resolution
10x10 metres pixels
Time resolution
update every 3/4 days, depending on cloud cover
Crop canopy water content (CWC) is an essential indicator of crop physiological status. Leaf water potential, expressed in milligrams per square centimeter (mg/cm²), and relative water content are important variables in determining water deficit and drought effects.

Soil moisture index
Spatial resolution
10x10 metres pixels
Time resolution
update every 3/4 days, depending on cloud cover
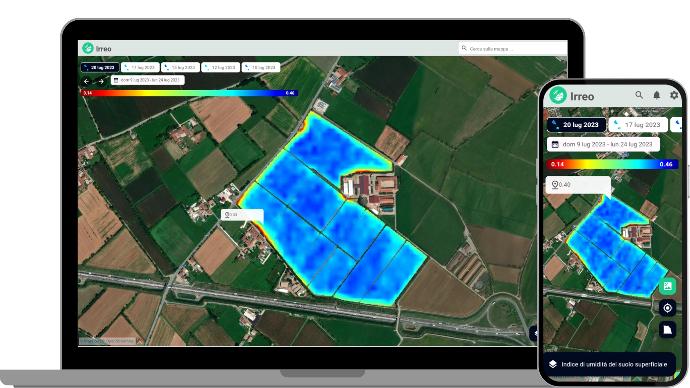
The soil moisture index (NSMI) represents the current soil moisture relative to the permanent wilting point and field capacity.
Index values range from 0 to 1, with 0 indicating extreme dry conditions and 1 indicating extreme wet conditions. It can be used before planting to check for drainage problems in the soil.
Soil moisture index
Spatial resolution
10x10 metres pixels
Time resolution
update every 3/4 days, depending on cloud cover
The soil moisture index (NSMI) represents the current soil moisture relative to the permanent wilting point and field capacity.
Index values range from 0 to 1, with 0 indicating extreme dry conditions and 1 indicating extreme wet conditions. It can be used before planting to check for drainage problems in the soil.
How does the satellite data work?
f
f
How does the satellite data work?
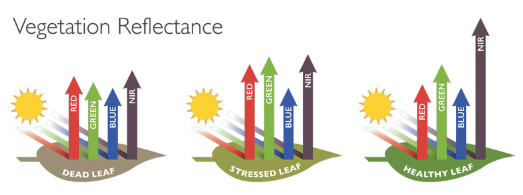
The sun emits radiation with different wavelengths and frequencies. The electromagnetic spectrum (EM spectrum) denotes the set of all possible frequencies of electromagnetic radiation. The entire spectrum is divided into the visible spectrum part, which originates light, and the non-visible spectrum parts with wavelengths longer or shorter than the visible spectrum.
Vegetation absorbs solar radiation in different bands, that is, in different frequency ranges and wavelengths, and re-emits a different percentage of it in each. The percentage of re-emitted radiation in specific bands, such as those of near infrared (NIR), red (RED), and short wave infrared (SWIR), indicates plant health or water stress.
Check out our graphs
Irreo provides you with specific charts for each field sector, with useful information for proper crop management.
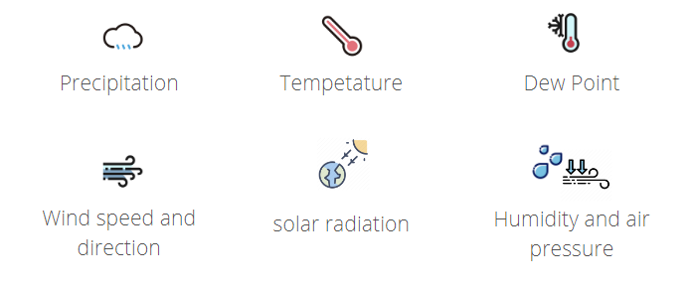
2) Weather data
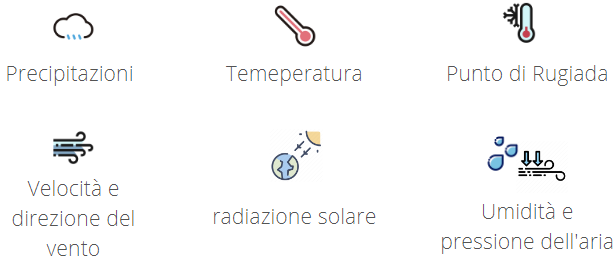
With Irreo you can obtain hyperlocal weather data, historical data and weather forecasts anywhere in the world and specific to the agricultural sector.
With Irreo you can obtain hyperlocal weather data, historical data and weather forecasts anywhere in the world and specific to the agricultural sector.

With Irreo you can obtain hyperlocal weather data, historical data and weather forecasts anywhere in the world and specific to the agricultural sector.
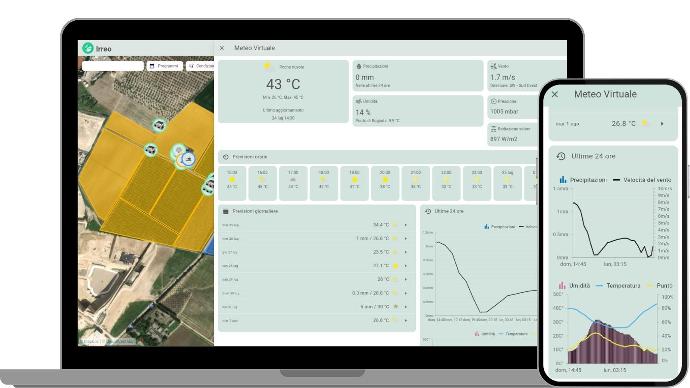
Virtual weather station
Spatial resolution
1 Km²
Time resolution
update every 15 minuti
Virtual weather stations are points identified by geographical coordinates for which Irreo makes use of multiple data sources, including nearby weather stations, doppler radar, satellites and atmospheric reanalysis products.
These parameters are fundamental for the calculation of evapotranspiration and in the irrigation budget model.

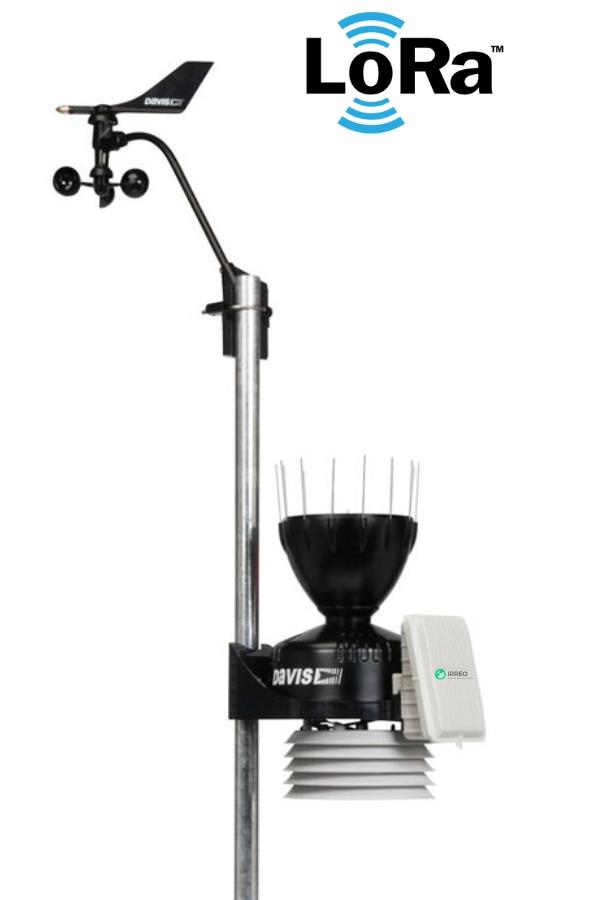
Irreo LoRa Meteo
The unit consists of a data logger (Irreo LoRa Meteo) connected via connectors to the station's various sensors, together with a solar panel, a charger and a battery to power the system.
The LoRa modem for connection to the Irreo Cloud system will automatically integrate the information received from the weather station to improve the estimation of your crops' water consumption.
You have two configurations available in combination with Irreo LoRa Weather:
- Irreo Basic weather station with rain gauge, air temperature sensor and air humidity sensor;
- Irreo Plus weather station with rain gauge, air temperature sensor, air humidity sensor, wind speed and direction sensors and solar radiation sensor.
Start planning today the company of tomorrow.
Siamo a tua disposizione.
Contattaci per rivolgerci domande, per richiedere un preventivo o un confronto con un nostro tecnico.
Start planning today the company of tomorrow.
We are at your disposal. Contact us to ask questions, to request a quote or a consultation with one of our technicians.
Start planning today the company of tomorrow.
Siamo a tua disposizione. Contattaci per rivolgerci domande, per
richiedere un preventivo o un confronto con un nostro tecnico.
Start planning today the company of tomorrow.
We are at your disposal. Contact us to ask questions, to
request a quote or a consultation with one of our technicians.